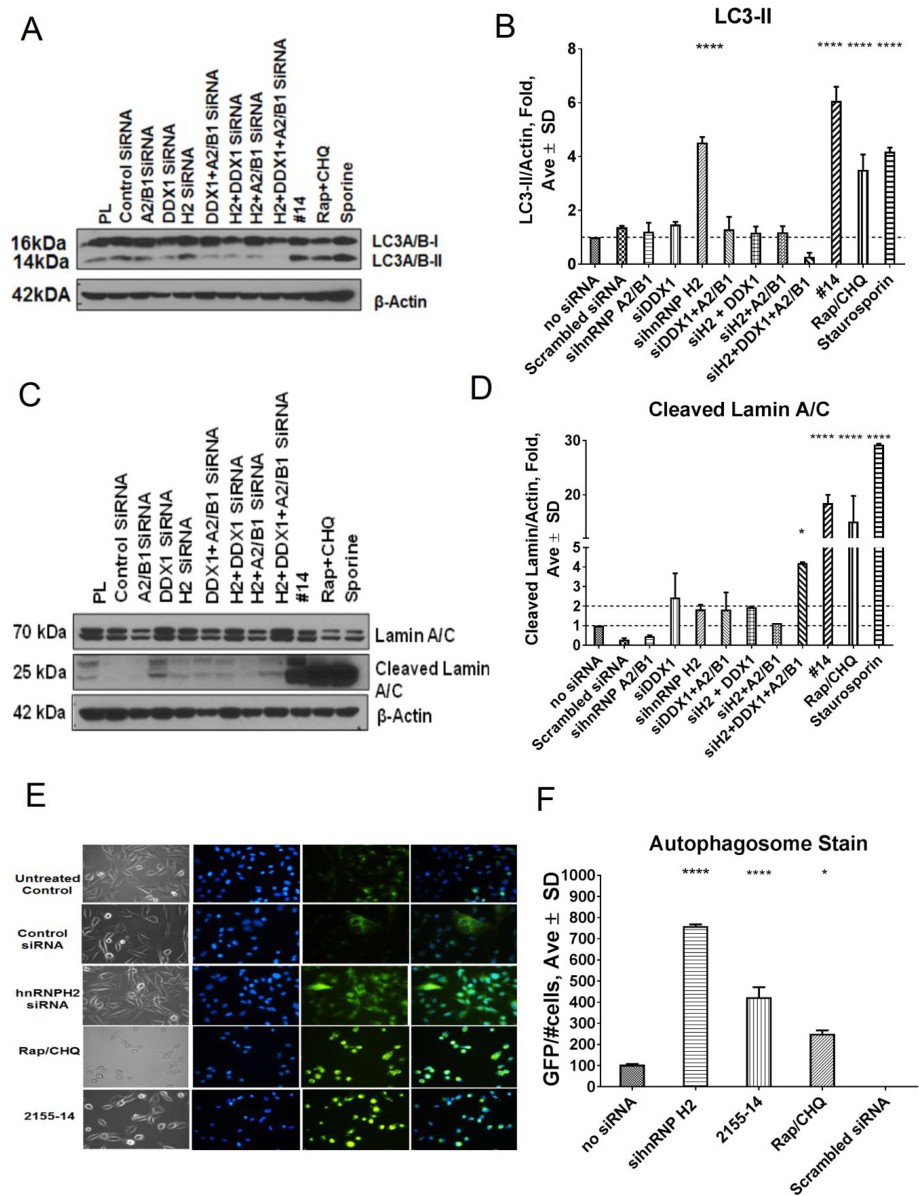
Fig. 10. Effect of siRNA knockdown on LC3-II and lamin A/C levels. (A) Representative western blot of LC3-II in WM266-4 lysates in response to siRNA treatment and (B) its quantification. (C) Representative western blot of lamin A/C in WM266-4 lysates in response to siRNA treatment and (D) its quantification. (E) WM266-4 cells showed increased autophagosome staining at 24 h after addition of hnRNP H2 siRNA and 2155-14. Nuclei are stained blue. (F) Autophagy (GFP) channel was used to quantify positive WM266-4 cells. Number of cells present in each well was normalized using DAPI-stained nuclei. One-way analysis of variance (ANOVA) was used followed by Sidak multiple comparisons test. The data shown were the mean ± SD, n=3. ***** - p<0.0001, *** - p<0.001, ** - p<0.01, * - p<0.05, rest = no significance.